Portfolio & P\&L
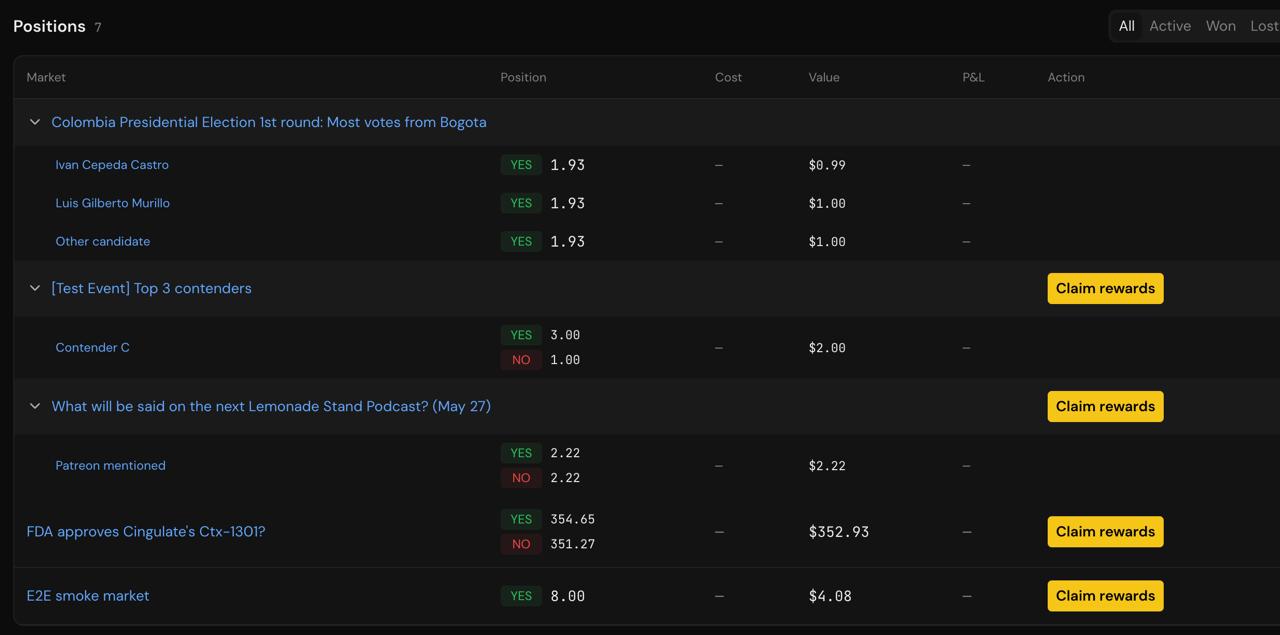
Active positions
Section titled “Active positions”Each row:
| Market | Side | Balance | Avg cost | Spot | Unrealized P&L | Action |
|---|---|---|---|---|---|---|
| BTC > $100k before 2027 | YES | 205.30 | $0.483 | $0.62 | +$28.20 | Sell / Redeem |
| ETH > $5k in 2026 | NO | 50.00 | $0.380 | $0.42 | +$2.00 | Sell |
- Balance: on-chain token count of YES/NO (the indexer hydrates cost basis).
- Avg cost: weighted-average purchase cost.
- Spot: blended price from AMM v4 + best bid/ask on the CLOB (pricing layer).
- Unrealized P&L:
(spot - avgCost) × balance.
Realized vs unrealized P&L
Section titled “Realized vs unrealized P&L”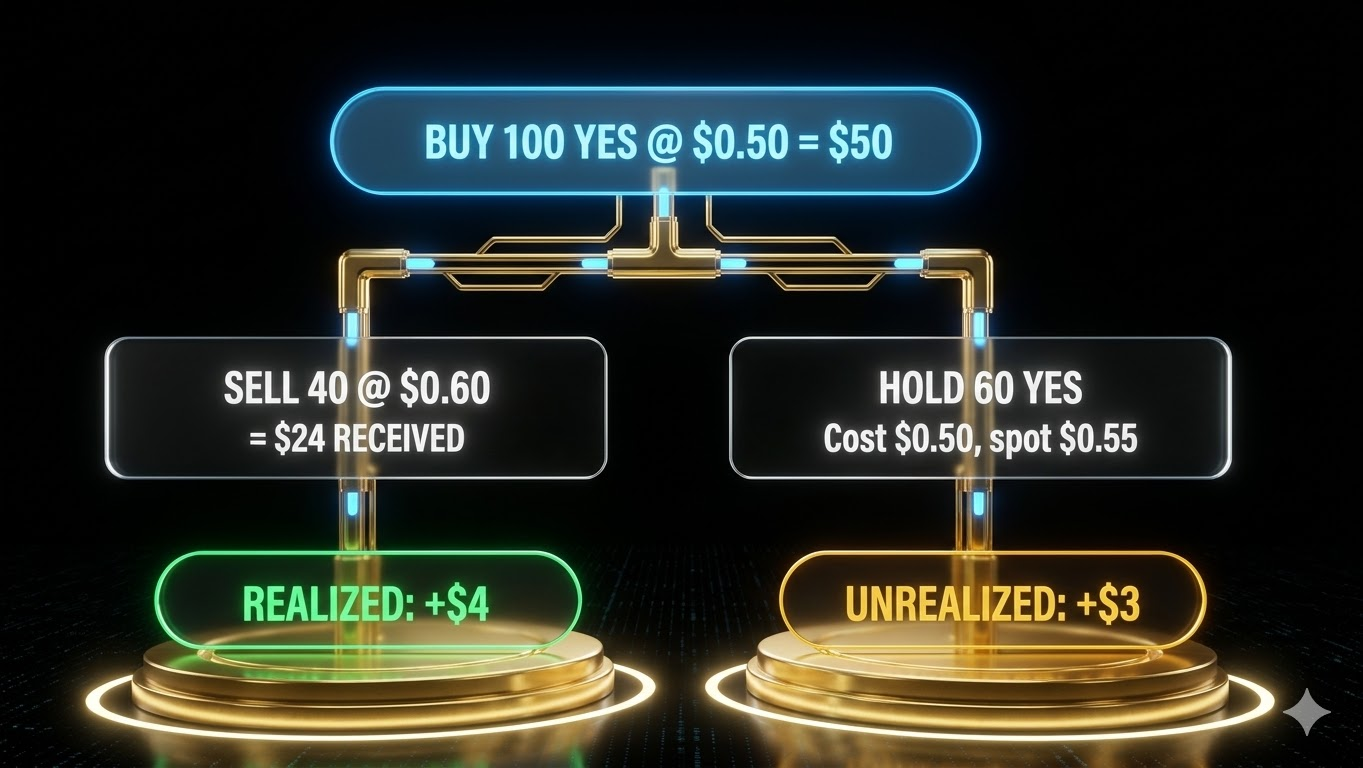
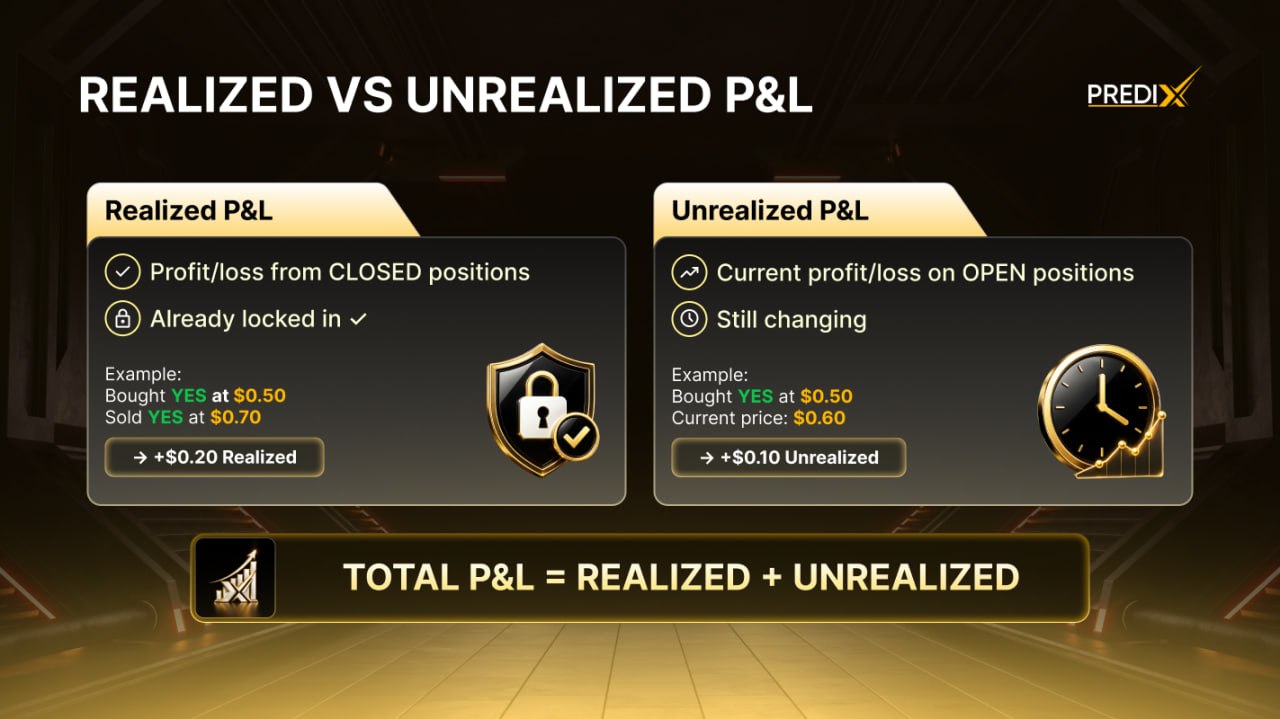
- Realized = P&L from closed positions or redeemed tokens.
- Unrealized = not yet locked in; depends on the current spot price.
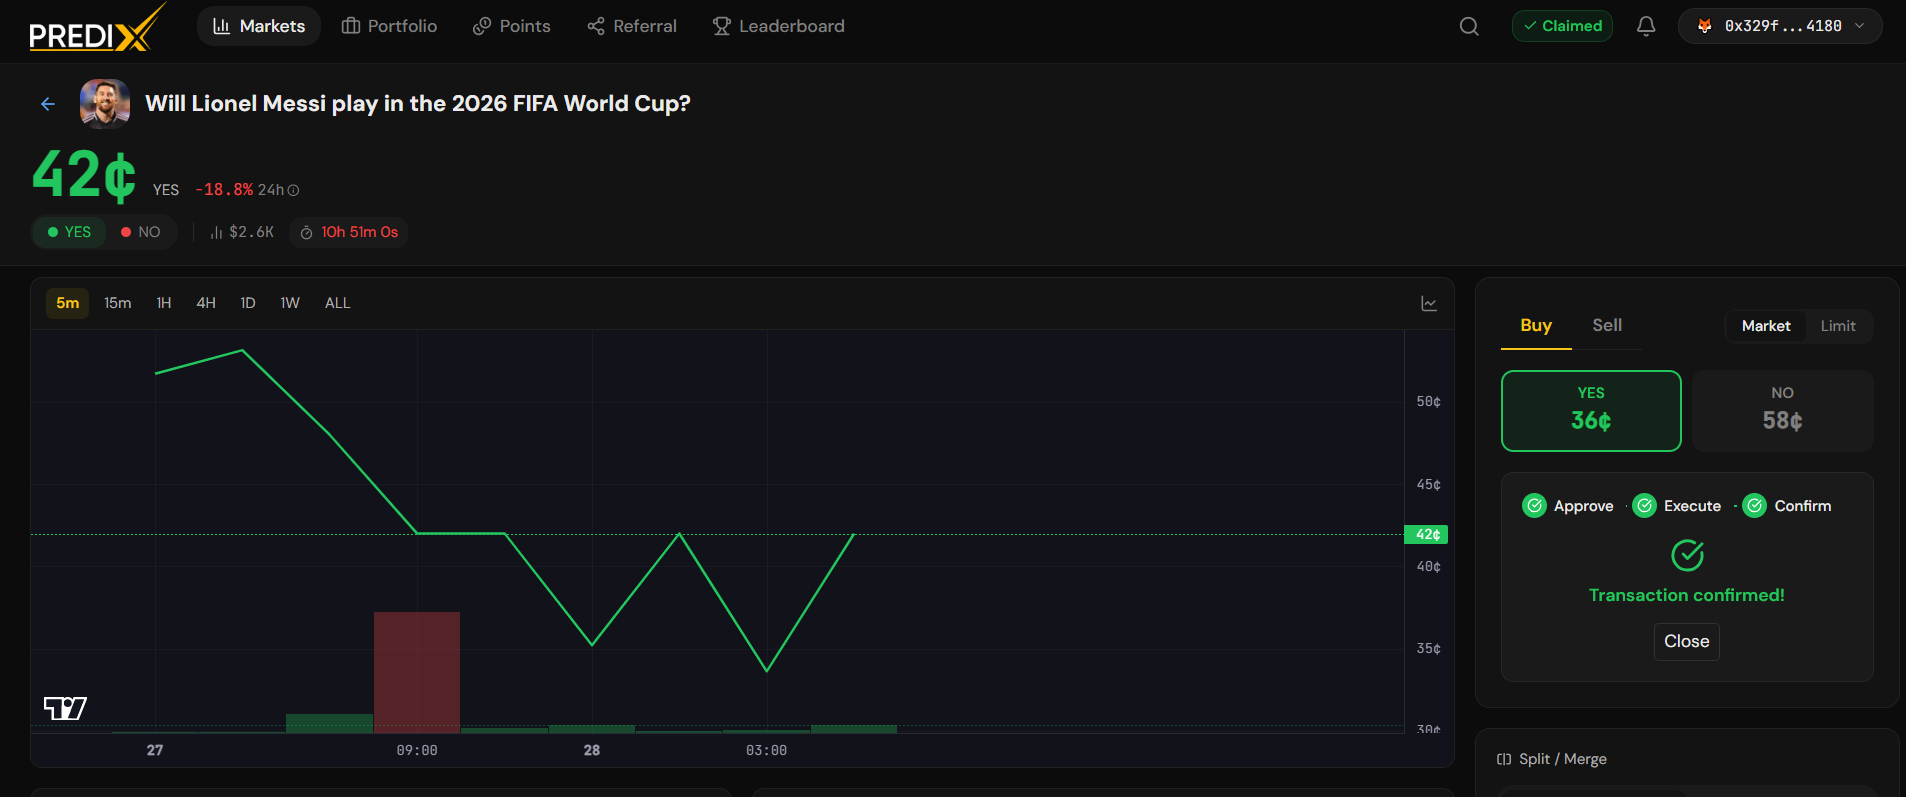
History - 6 types
Section titled “History - 6 types”Click any row → tx hash on the explorer.
| Cover image | |||
|---|---|---|---|
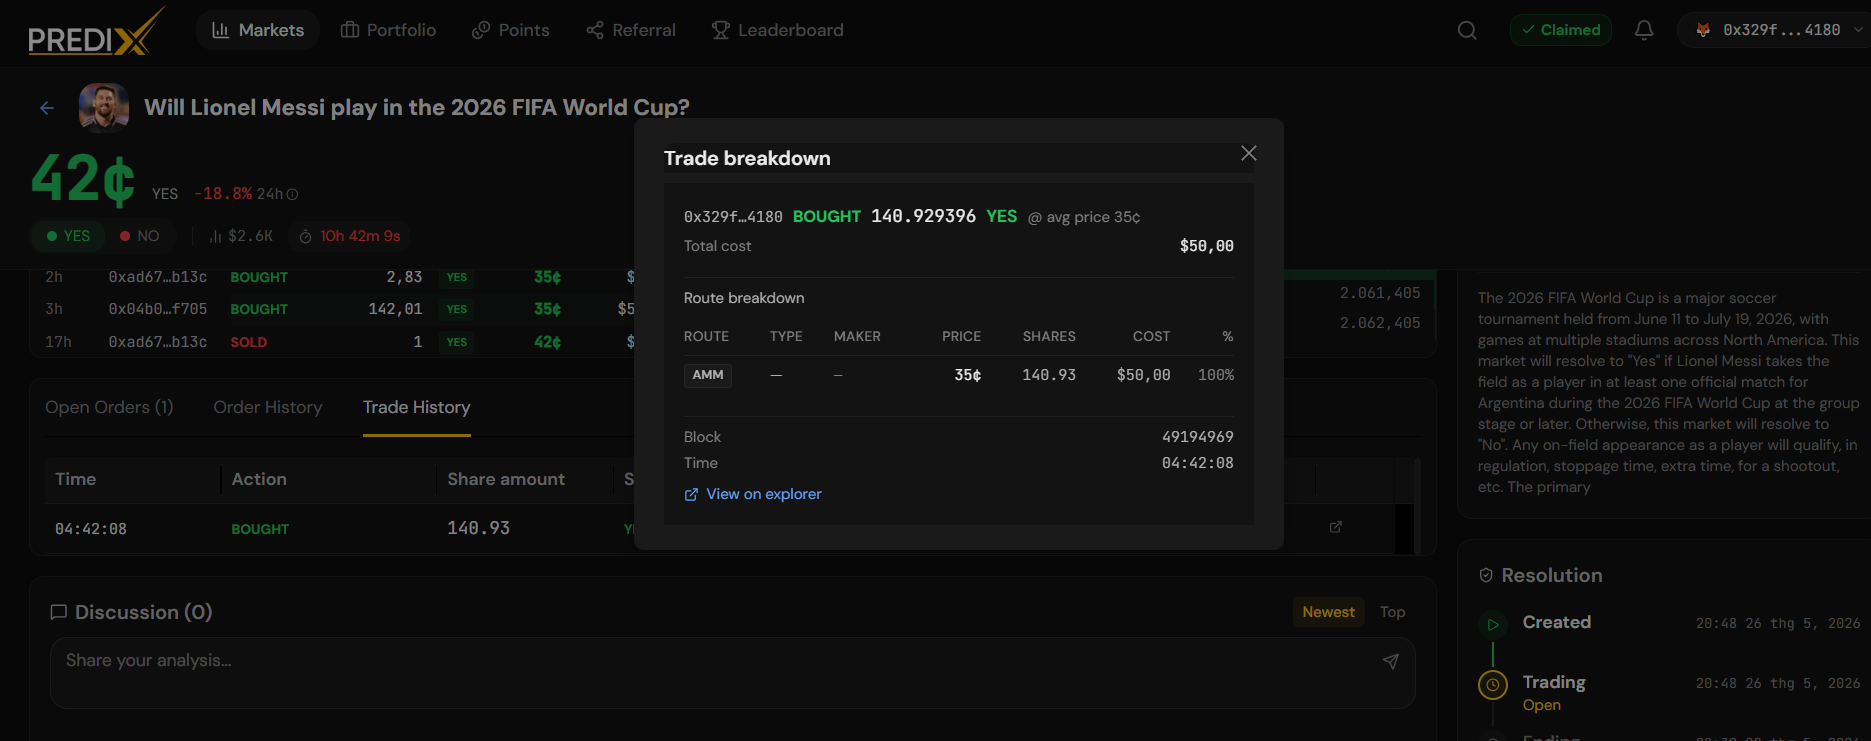
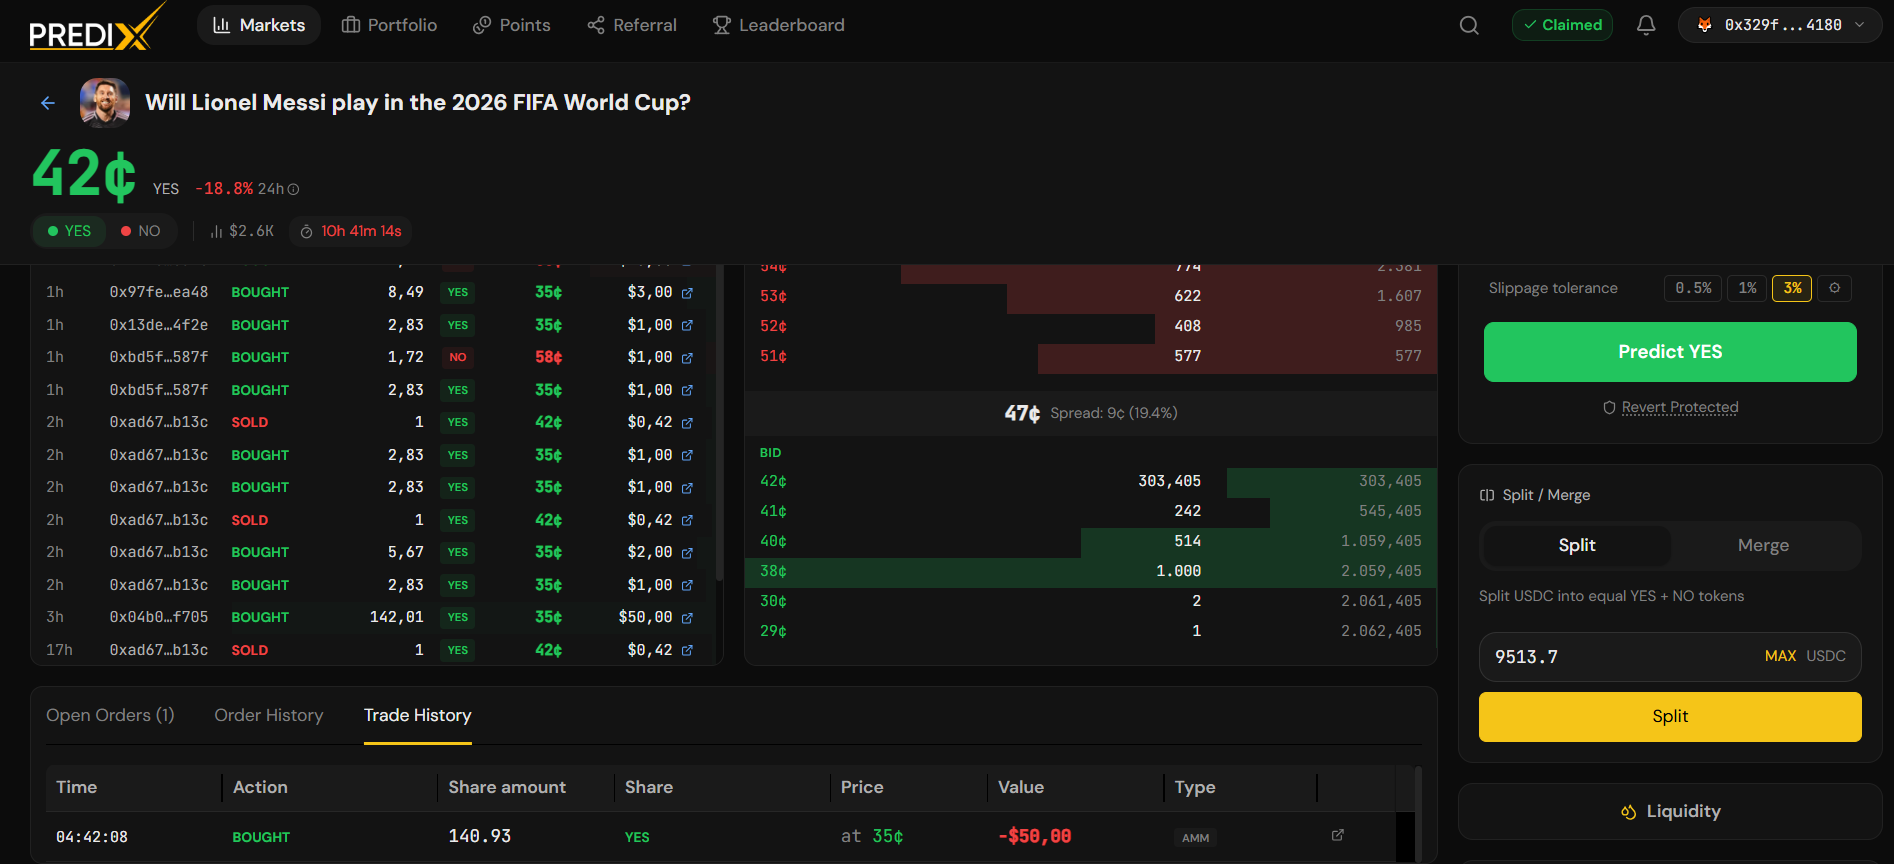
| Trade | Buy/sell via Router | Router.Trade | 32.png |
| Order | Place/cancel/fill limit order | Exchange.OrderPlaced/OrderMatched/OrderCancelled | 35.png |
| Split | Mint a YES+NO pair | MarketFacet.PositionSplit | 36.png |
| Merge | Burn YES+NO → USDC | MarketFacet.PositionMerged | |
| Claim | Redeem or refund | TokensRedeemed / MarketRefunded | 37.jpg |
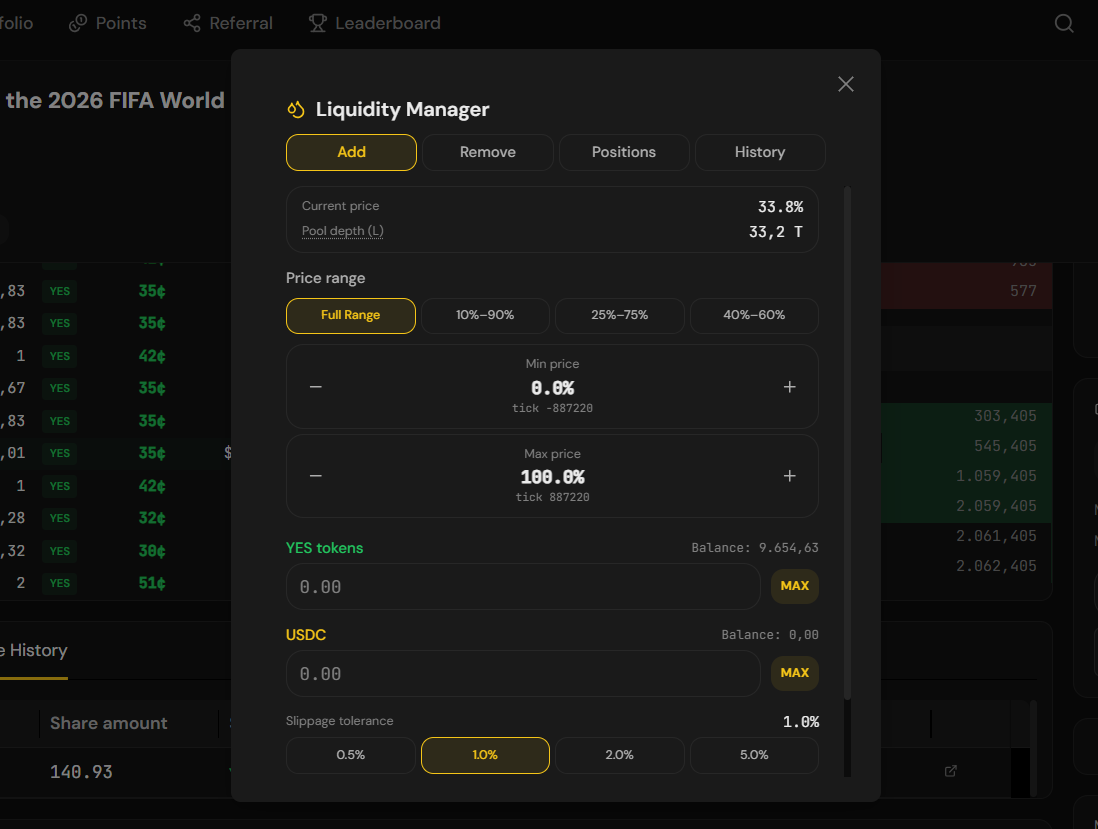
| LP | Add/remove/collect liquidity | PoolManager.ModifyLiquidity | 38.png |
Calibration - measure prediction accuracy
Section titled “Calibration - measure prediction accuracy”Applies to markets that have already resolved.
Brier score
Section titled “Brier score”The mean squared deviation between the price at which you bought and the actual outcome.
Brier = mean[(outcome - your_buy_price)²]Example:
- You buy YES @ $0.70 → event occurs (outcome=1) → Brier =
(1 - 0.7)² = 0.09 - You buy NO @ $0.30 → event occurs → Brier =
(0 - 0.3)² = 0.09
Low score = accurate pricing. High score = frequently wrong.
Accuracy band
Section titled “Accuracy band”A chart measuring: when you buy at price range X, what percentage of events actually occur?
| Your buy price | Actual win rate | Assessment |
|---|---|---|
$0.30 (low confidence) |
30% | Well-calibrated |
$0.30 (low confidence) |
70% | Underconfident - you are too cautious; consider trading larger |
$0.70 (high confidence) |
70% | Well-calibrated |
$0.70 (high confidence) |
30% | Overconfident - you are too confident; consider trading smaller |
The app plots your points on a scatter chart against the ideal diagonal (buy at $0.X → win X%). The closer to the diagonal, the more accurate your pricing.
Performance replay
Section titled “Performance replay”Re-watch your trading decisions over time:
- Select a period (7 days / 30 days / 90 days).
- Use the slider to time-travel.
- Each trade shows: market state at that moment, your decision, and the subsequent outcome.
- Insight: did you enter well or too early/late? Did you sell at the top or panic out?
A tool to help you recognize your own biases.
Streaks & badges
Section titled “Streaks & badges”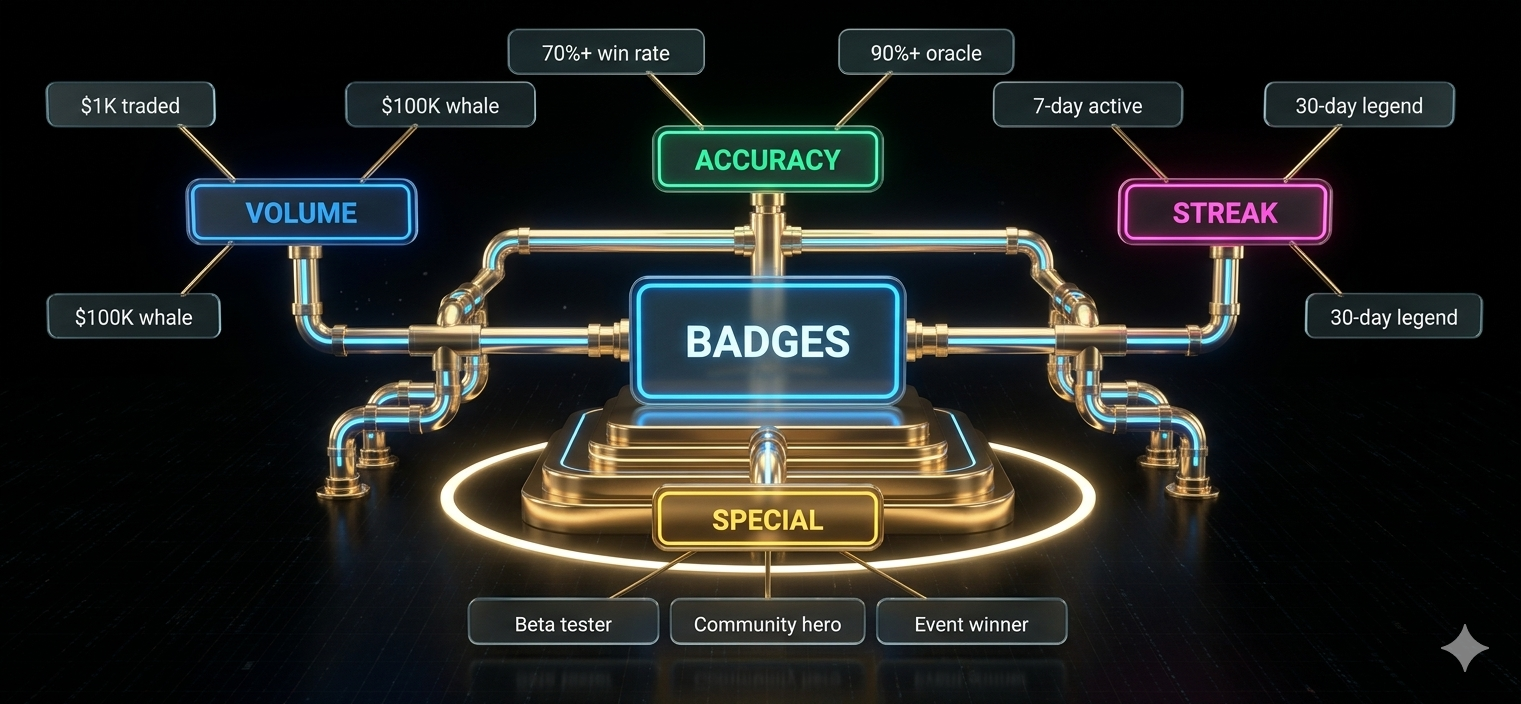
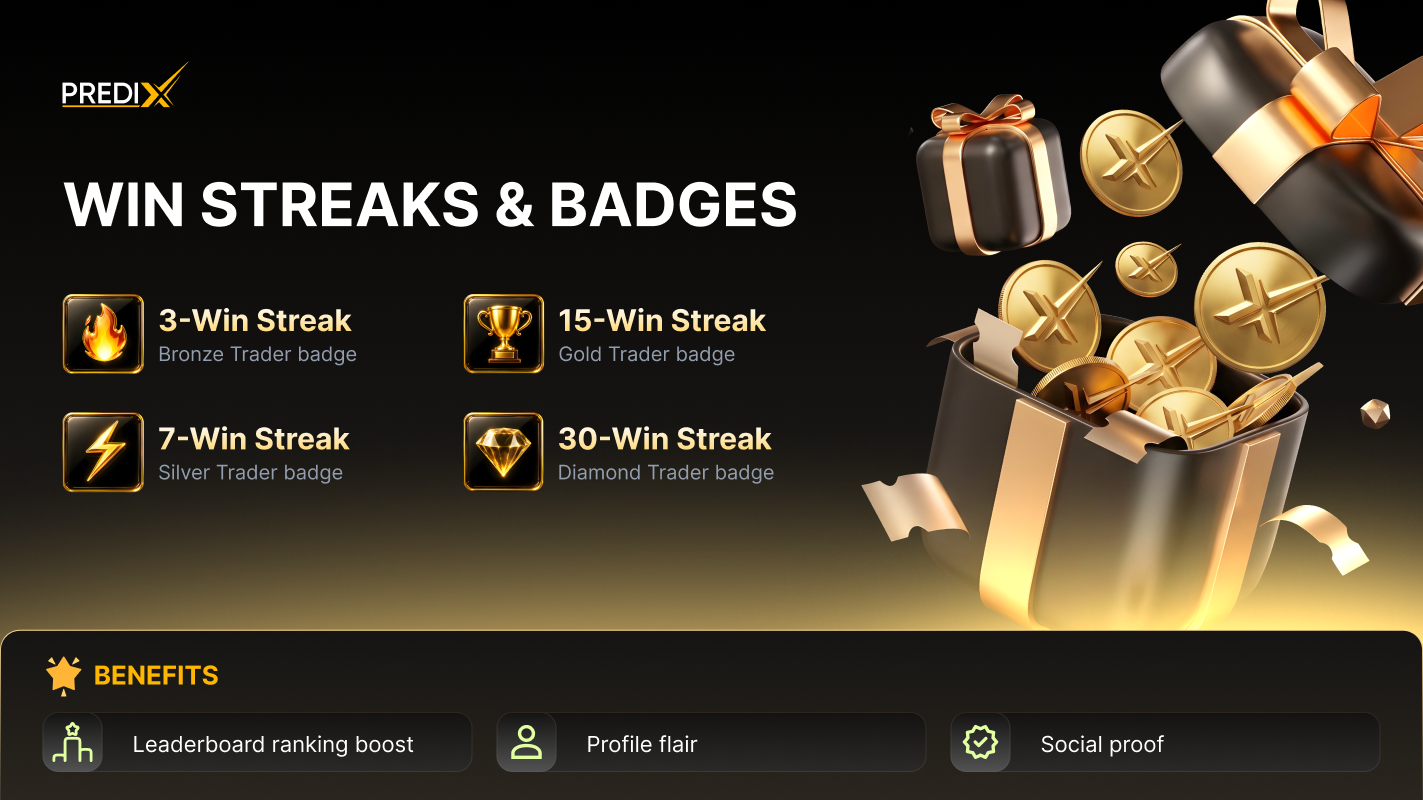
Badges are NFTs - shareable and serve as profile signatures. Details: Rewards & gamification.
LP positions
Section titled “LP positions”The Liquidity tab in your portfolio:
- Each row = 1 LP NFT.
- Displays: pool, range, deposit value, current value, accrued fees, APR.
- Actions: Collect fees, Add more, Remove.
Details: Liquidity provider.
Export & API
Section titled “Export & API”- Export tab → download a CSV of all history (for tax / accounting purposes).
- Developers can access directly:
- Indexer:
GET /api/users/:address/portfolio - BE:
GET /api/v1/users/:address/portfolio
- Indexer:
After endTime, not yet resolved
Section titled “After endTime, not yet resolved”When a market passes endTime but has not been resolved:
- Trading is closed; you cannot sell.
- Unrealized =
cost basis × balance(hold until resolution). - The UI shows a Pending resolve badge.
- After resolution → winning YES = $1, losing NO = $0 → P&L is settled.
Rebalance suggestions
Section titled “Rebalance suggestions”The app analyzes your portfolio and suggests:
- Which positions have excessive exposure (concentration risk)?
- Which markets are approaching endTime - should you close beforehand?
- Which limit orders are stale (price far from the market)?
Notifications can be toggled in Notifications & Alerts.